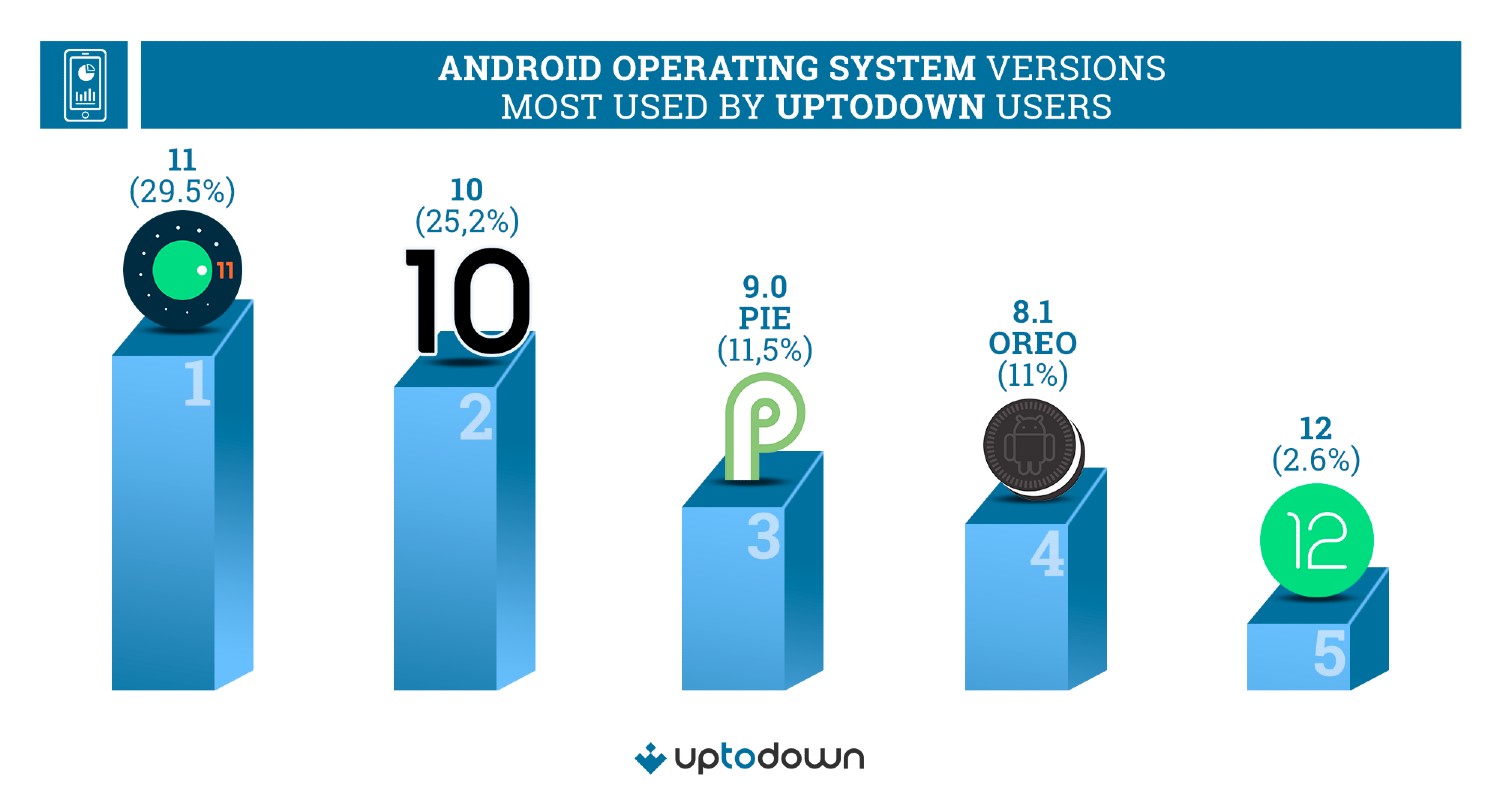
Back in the day, Google used to be very good about providing distribution numbers for Android. We’d see a pie graph with a breakdown of each OS version’s portion of the pie. For us, it was a great way to see how well newer versions of Android were being adopted. Thanks to figures calculated by Uptodown, we’ve got an updated look at how things are going for Android versions.
First, a note about Uptodown for those who don’t know. It’s a 3rd-party Android app store with over 130 million active monthly users across the globe. It is these users that the following data has been collected from, so shoutout to those users. With that out of the way, let’s dive into the data.
Most Used Android Version
Among Uptodown users, Android 11 holds the top spot with 29.5% of the pie. That’s followed closely by Android 10 with a number of 25.2%. If you look for the latest version of Android, that being Android 12, it’s currently on just 2.6% of user devices. Heck, even Oreo is sitting above Android 12. While disappointing, it’s not surprising. That’s very much always been the story of Android.
Device Maker and Browser
Uptodown also provided information on its users’ device maker and most used browser. As shown, we have South Korea’s Samsung coming in strong with over 31% of the market, followed by China’s Xiaomi, Huawei, Oppo, and Vivo. Again, no surprises here, with the majority of the service’s users presumably located outside of the US.
Browsers used are also detailed. According to the data, Chrome is by faaar the most used browser with 83% of the pie. That’s then followed by Samsung’s stock browser with just 5%. That’s pure domination right there, which may actually lead to Droid Life running a poll among our own readers.
If there is a takeaway from this data, it’s that Android OS adoption is still extremely slow. It’s a bummer, but we’re certainly used to it by now.
// Uptodown


Collapse Show Comments6 Comments